Red Sea Rerouting: How the Cape of Good Hope Is Redrawing Bunker Demand
The Cape of Good Hope diversion costs roughly $1 million in extra bunker per Asia-Europe round-trip and adds about ten days at sea. If your fleet was built around a Suez-Bab-el-Mandeb routing — and most container, tan…
The Cape of Good Hope diversion costs roughly $1 million in extra bunker per Asia-Europe round-trip and adds about ten days at sea. If your fleet was built around a Suez-Bab-el-Mandeb routing — and most container, tanker, and Capesize operators planned that way for thirty years — your 2025 fuel budget is structurally different from your 2022 budget. This article walks through the cost, the new map of bunker demand, and what we are telling charterers about where the demand picture goes from here.
The disruption in numbers
Houthi attacks on commercial shipping in and around Bab-el-Mandeb began in November 2023. By October 2024 the US Defense Intelligence Agency had counted over 190 attacks. Container shipping through the Red Sea dropped by approximately 90% between December 2023 and February 2024.
The major carriers responded by rerouting. Maersk, MSC, CMA CGM, Hapag-Lloyd, Evergreen and ONE moved the bulk of their Asia-Europe and Asia-US East Coast services around the Cape of Good Hope. Tanker operators and dry bulk owners followed for vessel classes where the war-risk premium outweighed the routing cost.
By late 2024 the Houthis signalled willingness to halt attacks. Marine underwriters did not return to pre-2023 risk pricing. Most major operators kept the Cape routing through January 2025.
What the diversion costs per voyage
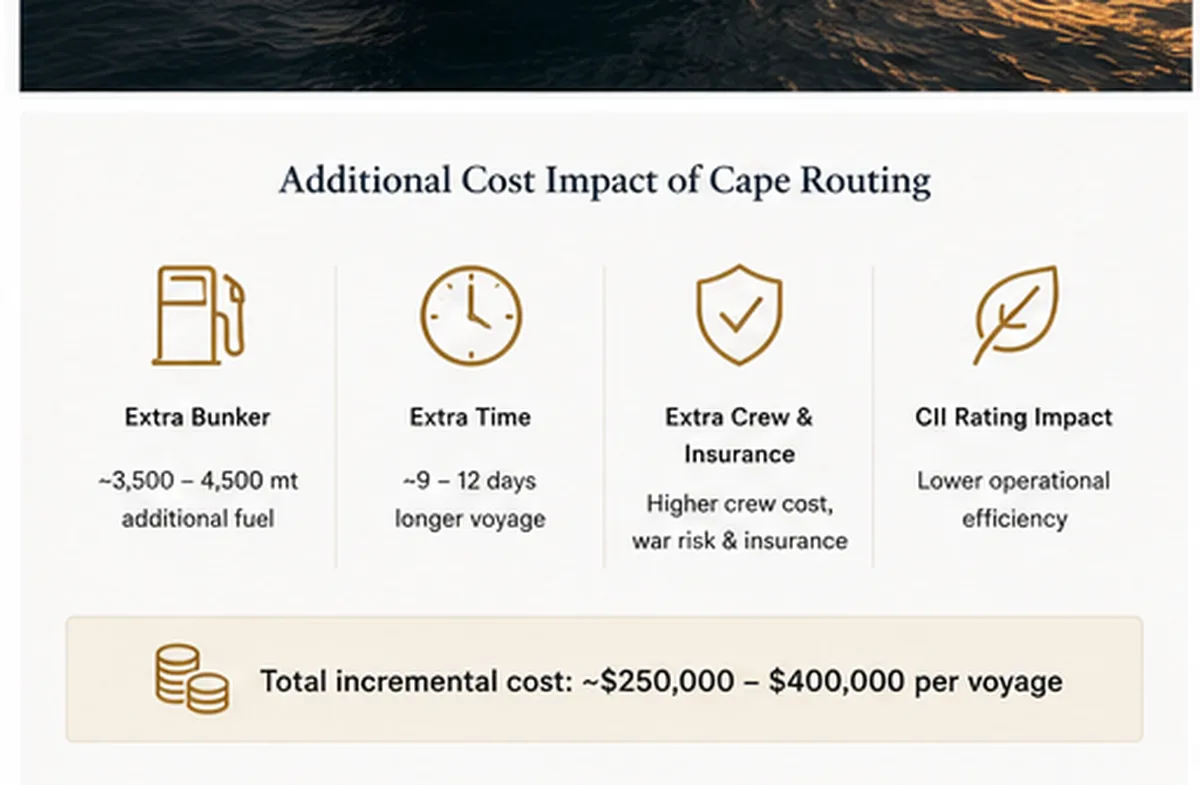
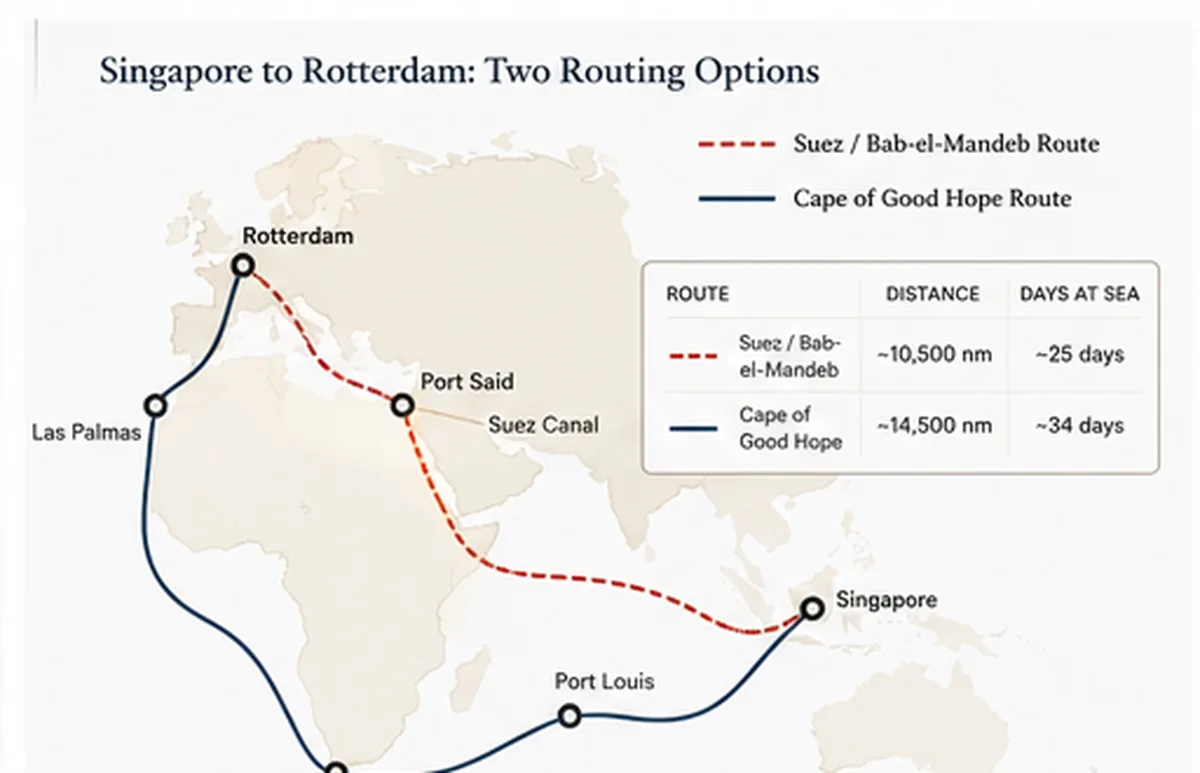
The Cape of Good Hope routing adds roughly 3,500 nautical miles each way on a Singapore–Rotterdam round-trip. At commercial steaming speeds, that is about ten extra days. The bunker cost depends on vessel class and consumption.
Worked example: 14,000-TEU container vessel, 220 MT/day VLSFO consumption at sea speed, $580/MT average bunker price.
Item | Suez routing | Cape routing | Delta |
One-way distance (nm) | 8,300 | 11,800 | +3,500 |
Sea days at 18 kts | 19 | 27 | +8 |
Round-trip bunker (MT) | 8,360 | 11,880 | +3,520 |
Round-trip bunker cost | $4.85m | $6.89m | +$2.04m |
Plus war-risk premium for Suez route (if used) | $300-700k | n/a | included |
A Suezmax tanker on the same Asia-Europe lane sees a similar order-of-magnitude increase in absolute terms, less in percentage terms. A Capesize bulk carrier on Iron Ore Australia–Europe routes via Cape was already the standard, so for that vessel class the change is smaller.
For a container line running fifteen weekly strings on Asia-Europe, the cumulative bunker shift is significant — multiple billions of dollars per year of incremental fuel demand globally.
How global bunker demand has redistributed
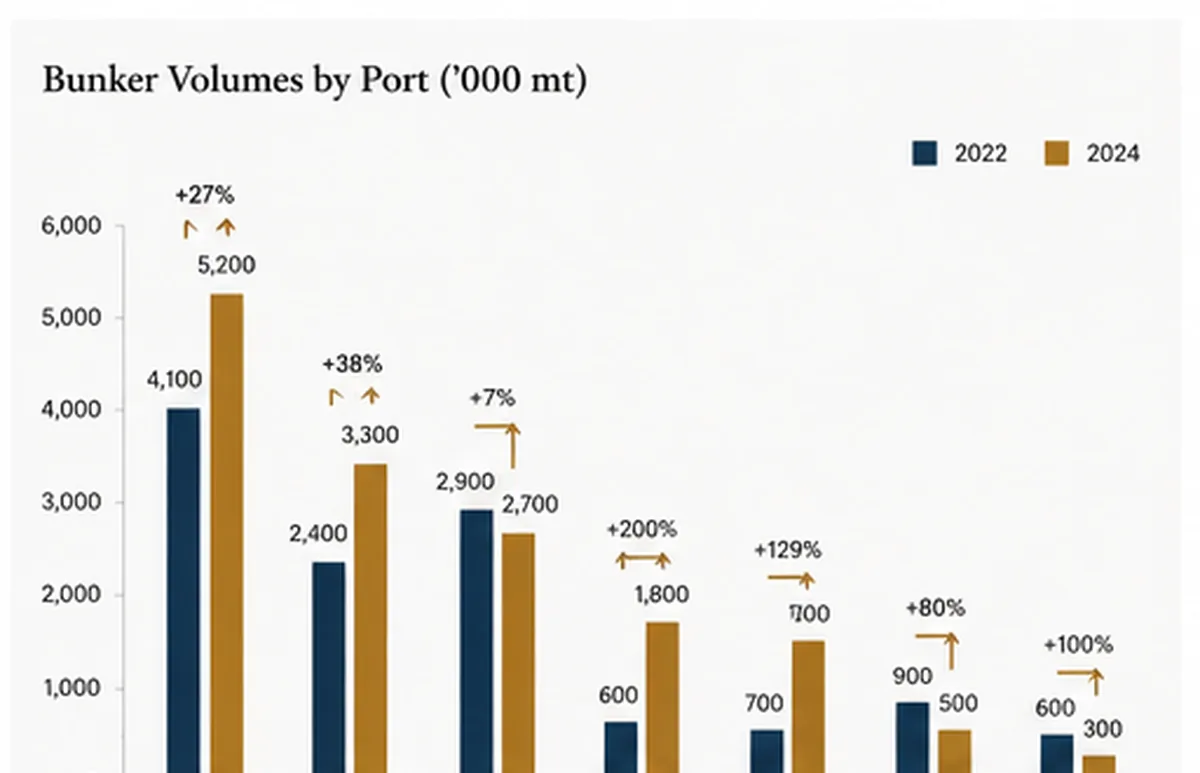
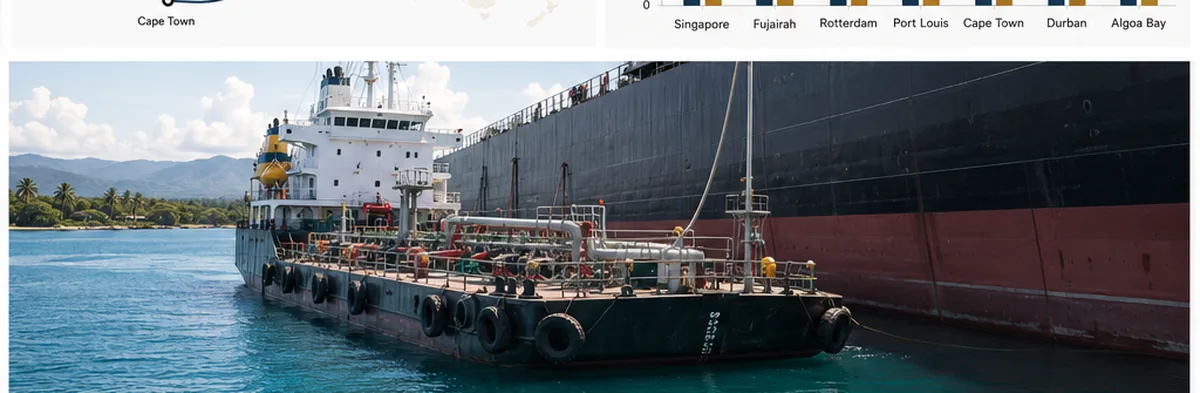
The geographic redistribution is what matters for trading desks. The traditional bunker hubs — Singapore, Fujairah, Rotterdam, Algeciras, Las Palmas — have all moved, but in different directions.
Port | 2022 volume (MT) | 2024 volume (MT) | Change |
Singapore | ~50m | ~54.9m | Modest rise |
Fujairah | ~30m | ~33m | Steady rise |
Rotterdam | ~9.5m | ~10.2m | Slight rise |
Port Louis (Mauritius) | ~0.5m | ~1.0m | Doubled |
Cape Town | ~0.6m | ~0.9m | +50% |
Durban | ~0.5m | ~0.8m | +60% |
Algoa Bay (anchorage) | ~0.1m | ~0.3m | Tripled |
The South African and Indian Ocean island ports are the standout movers. Vessels rerouting around the Cape need to refuel somewhere on the southern leg. Port Louis in Mauritius has become a meaningful staging port; Algoa Bay anchorage off Port Elizabeth has tripled from a small base.
For Fujairah, the impact is more subtle. The port did not lose Asia-Europe transit volume — that traffic was always east of the Strait of Hormuz. What it gained was firmer demand from Indian Ocean voyages that previously chose to bunker at Salalah (Oman) or at Aden (no longer viable). Fujairah’s anchorage congestion has increased; barge waits have lengthened in peak weeks.
What changed between the late 2024 Houthi ceasefire and early 2025
The Houthi political wing made statements in late 2024 indicating willingness to halt attacks on commercial shipping. The maritime market did not snap back. Three reasons:
Insurance. War-risk premiums for Bab-el-Mandeb transit climbed through 2024 to multiple percent of hull value for some vessel classes. Underwriters require sustained risk-free passage before re-pricing.
Schedule reliability. Carriers built their 2025 sailing schedules around Cape routing in mid-2024. Re-routing back to Suez mid-schedule introduces port-omission risk, charter-party conflicts, and customer-service problems. Most carriers committed to the Cape route at least through Q2 2025.
Underwriter caution. Even if the route reopens, a single attack will close it again. Several major underwriters indicated they wanted six months of unbroken safe passage before reducing war-risk premiums to pre-2023 levels.
The result is a slow, conditional return — not a switch back.
How charter parties are repricing risk
In 2024 charter party clauses had to be rewritten to accommodate the new routing. The most-used updates:
- BIMCO War Risks Clause for Time Chartering 2013 activated to allow re-routing without breaching the charter
- Conwartime 2013 for voyage charters, with the Cape route as an explicit alternative
- Bunker Adjustment Factor (BAF) for liner shipping, repriced to reflect actual Cape-route consumption
- CII assistance clauses to accept that the longer route worsens the vessel’s Carbon Intensity Indicator rating — and to allocate the cost between owner and charterer
The CII issue is awkward. The IMO’s Carbon Intensity Indicator measures grams of CO₂ per deadweight-ton-mile. A longer routing means more emissions, but also more distance, so the per-distance metric does not necessarily worsen as much as raw fuel consumption suggests. Different charter forms allocate the rating penalty differently. Pre-2024 CP language does not handle this cleanly; expect to see CII-specific addenda in 2025 fixtures.
What we are telling charterers
Three working assumptions Au Club’s desk uses with charterer customers through 2025:
- The Cape routing continues for most carriers through Q2 2025 at minimum. Insurance and schedule inertia will outlast the operational risk reduction.
- Fujairah bunker premia to Singapore will hold or widen modestly. Indian Ocean rerouting and the Gulf’s stable supply give Fujairah a strategic role in 2025 that 2022 routing planning did not anticipate.
- Plan bunker stems with longer lay-cans. Anchorage congestion at Cape Town and Fujairah peaks unpredictably. Build flexibility into the charter party.
For voyage owners contracted on liner-fed routes, the bunker arithmetic has changed enough that 2022’s optimised stemming plans no longer apply. Re-modelling annual bunker cost with Cape-route assumptions is now a quarterly exercise, not an annual one.
FAQs
Are ships still avoiding the Red Sea in January 2025?
The majority of container shipping on Asia-Europe lanes continues to use the Cape of Good Hope route. Tanker traffic is mixed. Some bulk carriers have returned to the Suez route. Underwriter caution and schedule commitments make a full return unlikely before Q2 2025.
How much extra fuel does the Cape route use?
For a 14,000-TEU container vessel on Singapore-Rotterdam round-trip, approximately 3,500 MT extra VLSFO per round-trip, or about $2 million at $580/MT. Suezmax and Capesize equivalents differ.
Where are ships bunkering on the Cape route?
The growth ports are Port Louis (Mauritius), Cape Town, Algoa Bay anchorage, and Durban. Singapore, Fujairah, and Rotterdam remain dominant but for different reasons (Singapore Asia-end staging, Fujairah Indian Ocean staging, Rotterdam Europe-end).
Has Fujairah benefited from the Red Sea crisis?
Yes, modestly. Indian Ocean routing benefits Fujairah’s strategic position east of Hormuz. Bunker volume rose to approximately 33 million MT in 2024.
About Au Club
Au Club supplies VLSFO and HSFO marine fuels at Fujairah, Jebel Ali, Port Khalifa, and Khor Fakkan. ISO 8217:2024 compliant. Multiple physical suppliers per port for competitive price discovery. ISO 14001-aligned procedures. Contact our bunker desk for stem enquiries.